
Data Visualization
A web-based platform that turns complex datasets into visual stories with interactive charts, geographic maps, and dynamic tables.
Fast delivery, ongoing support.
Data Visualization
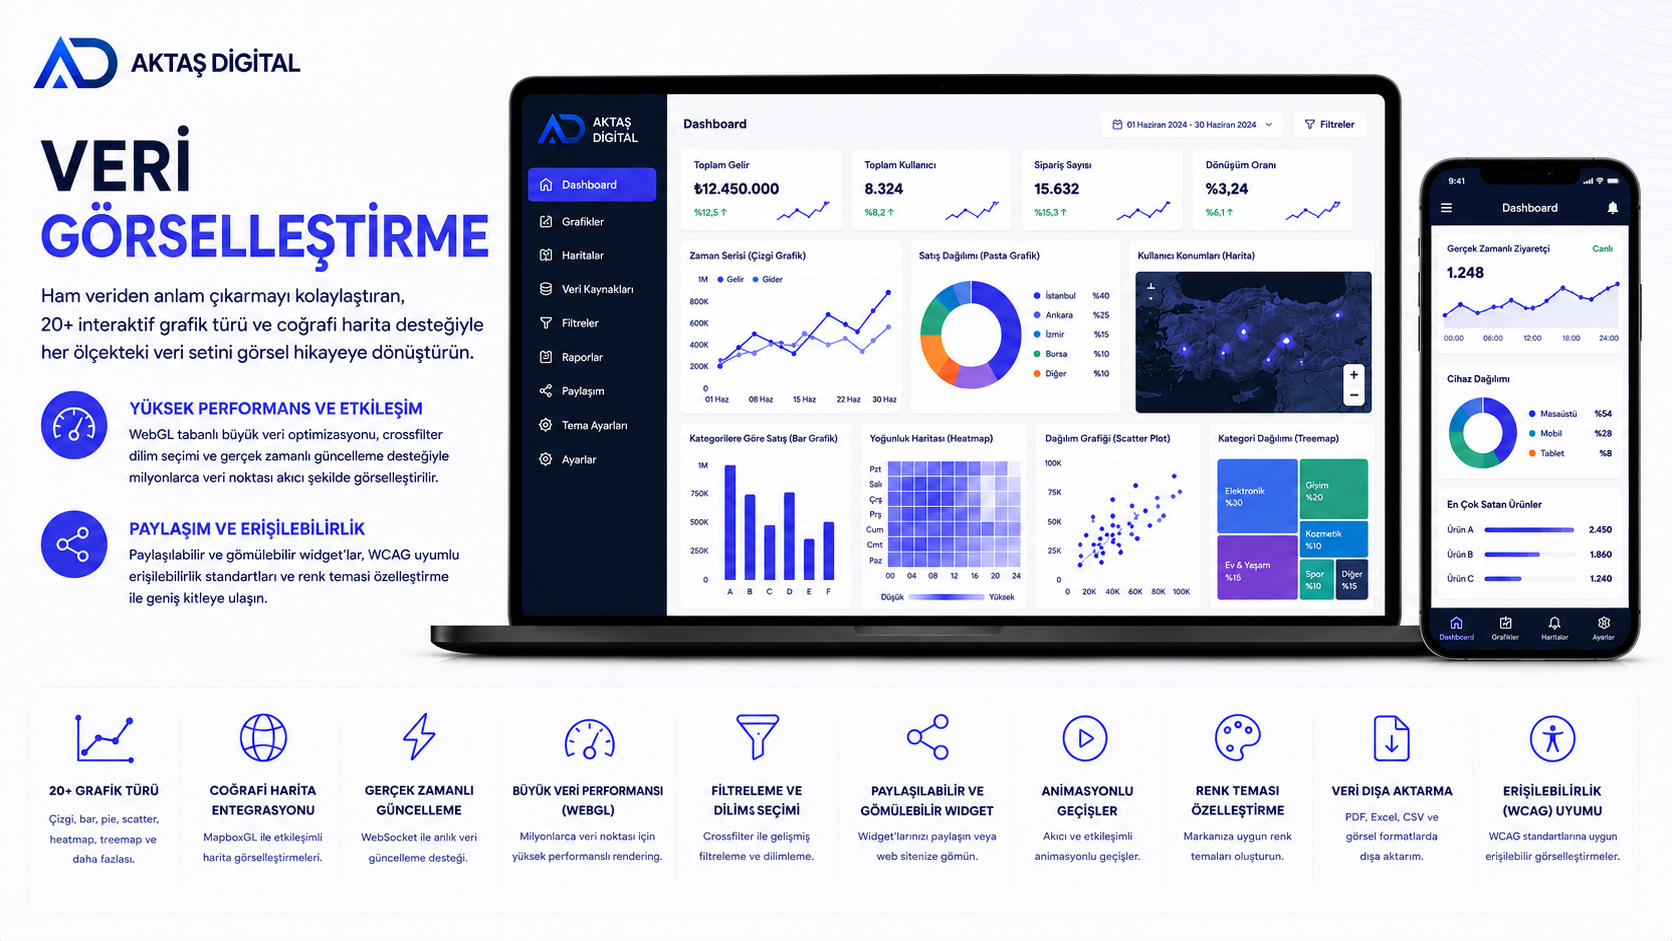
A platform that makes raw data easier to understand, turning datasets of any size into visual stories with support for more than 20 interactive chart types and geographic maps.
High Performance and Interactivity
Visualize millions of data points smoothly with WebGL-based big-data optimization, crossfilter slicing, and real-time updates.
Sharing and Accessibility
Create visualizations for broad audiences with shareable and embeddable widgets, WCAG-compliant accessibility, and customizable color themes.
What we offer
- More than 20 interactive chart types, including line, bar, pie, scatter, heatmap, and treemap
- Geographic maps with Mapbox GL
- Real-time data updates
- Big data performance optimization with WebGL
- Filtering and slicing with crossfilter
- Shareable and embeddable widgets
- Animated transitions
- Customizable color themes
- Data export
- WCAG accessibility compliance
Stay up to date with the industry.
Articles on technology, AI and digital transformation.